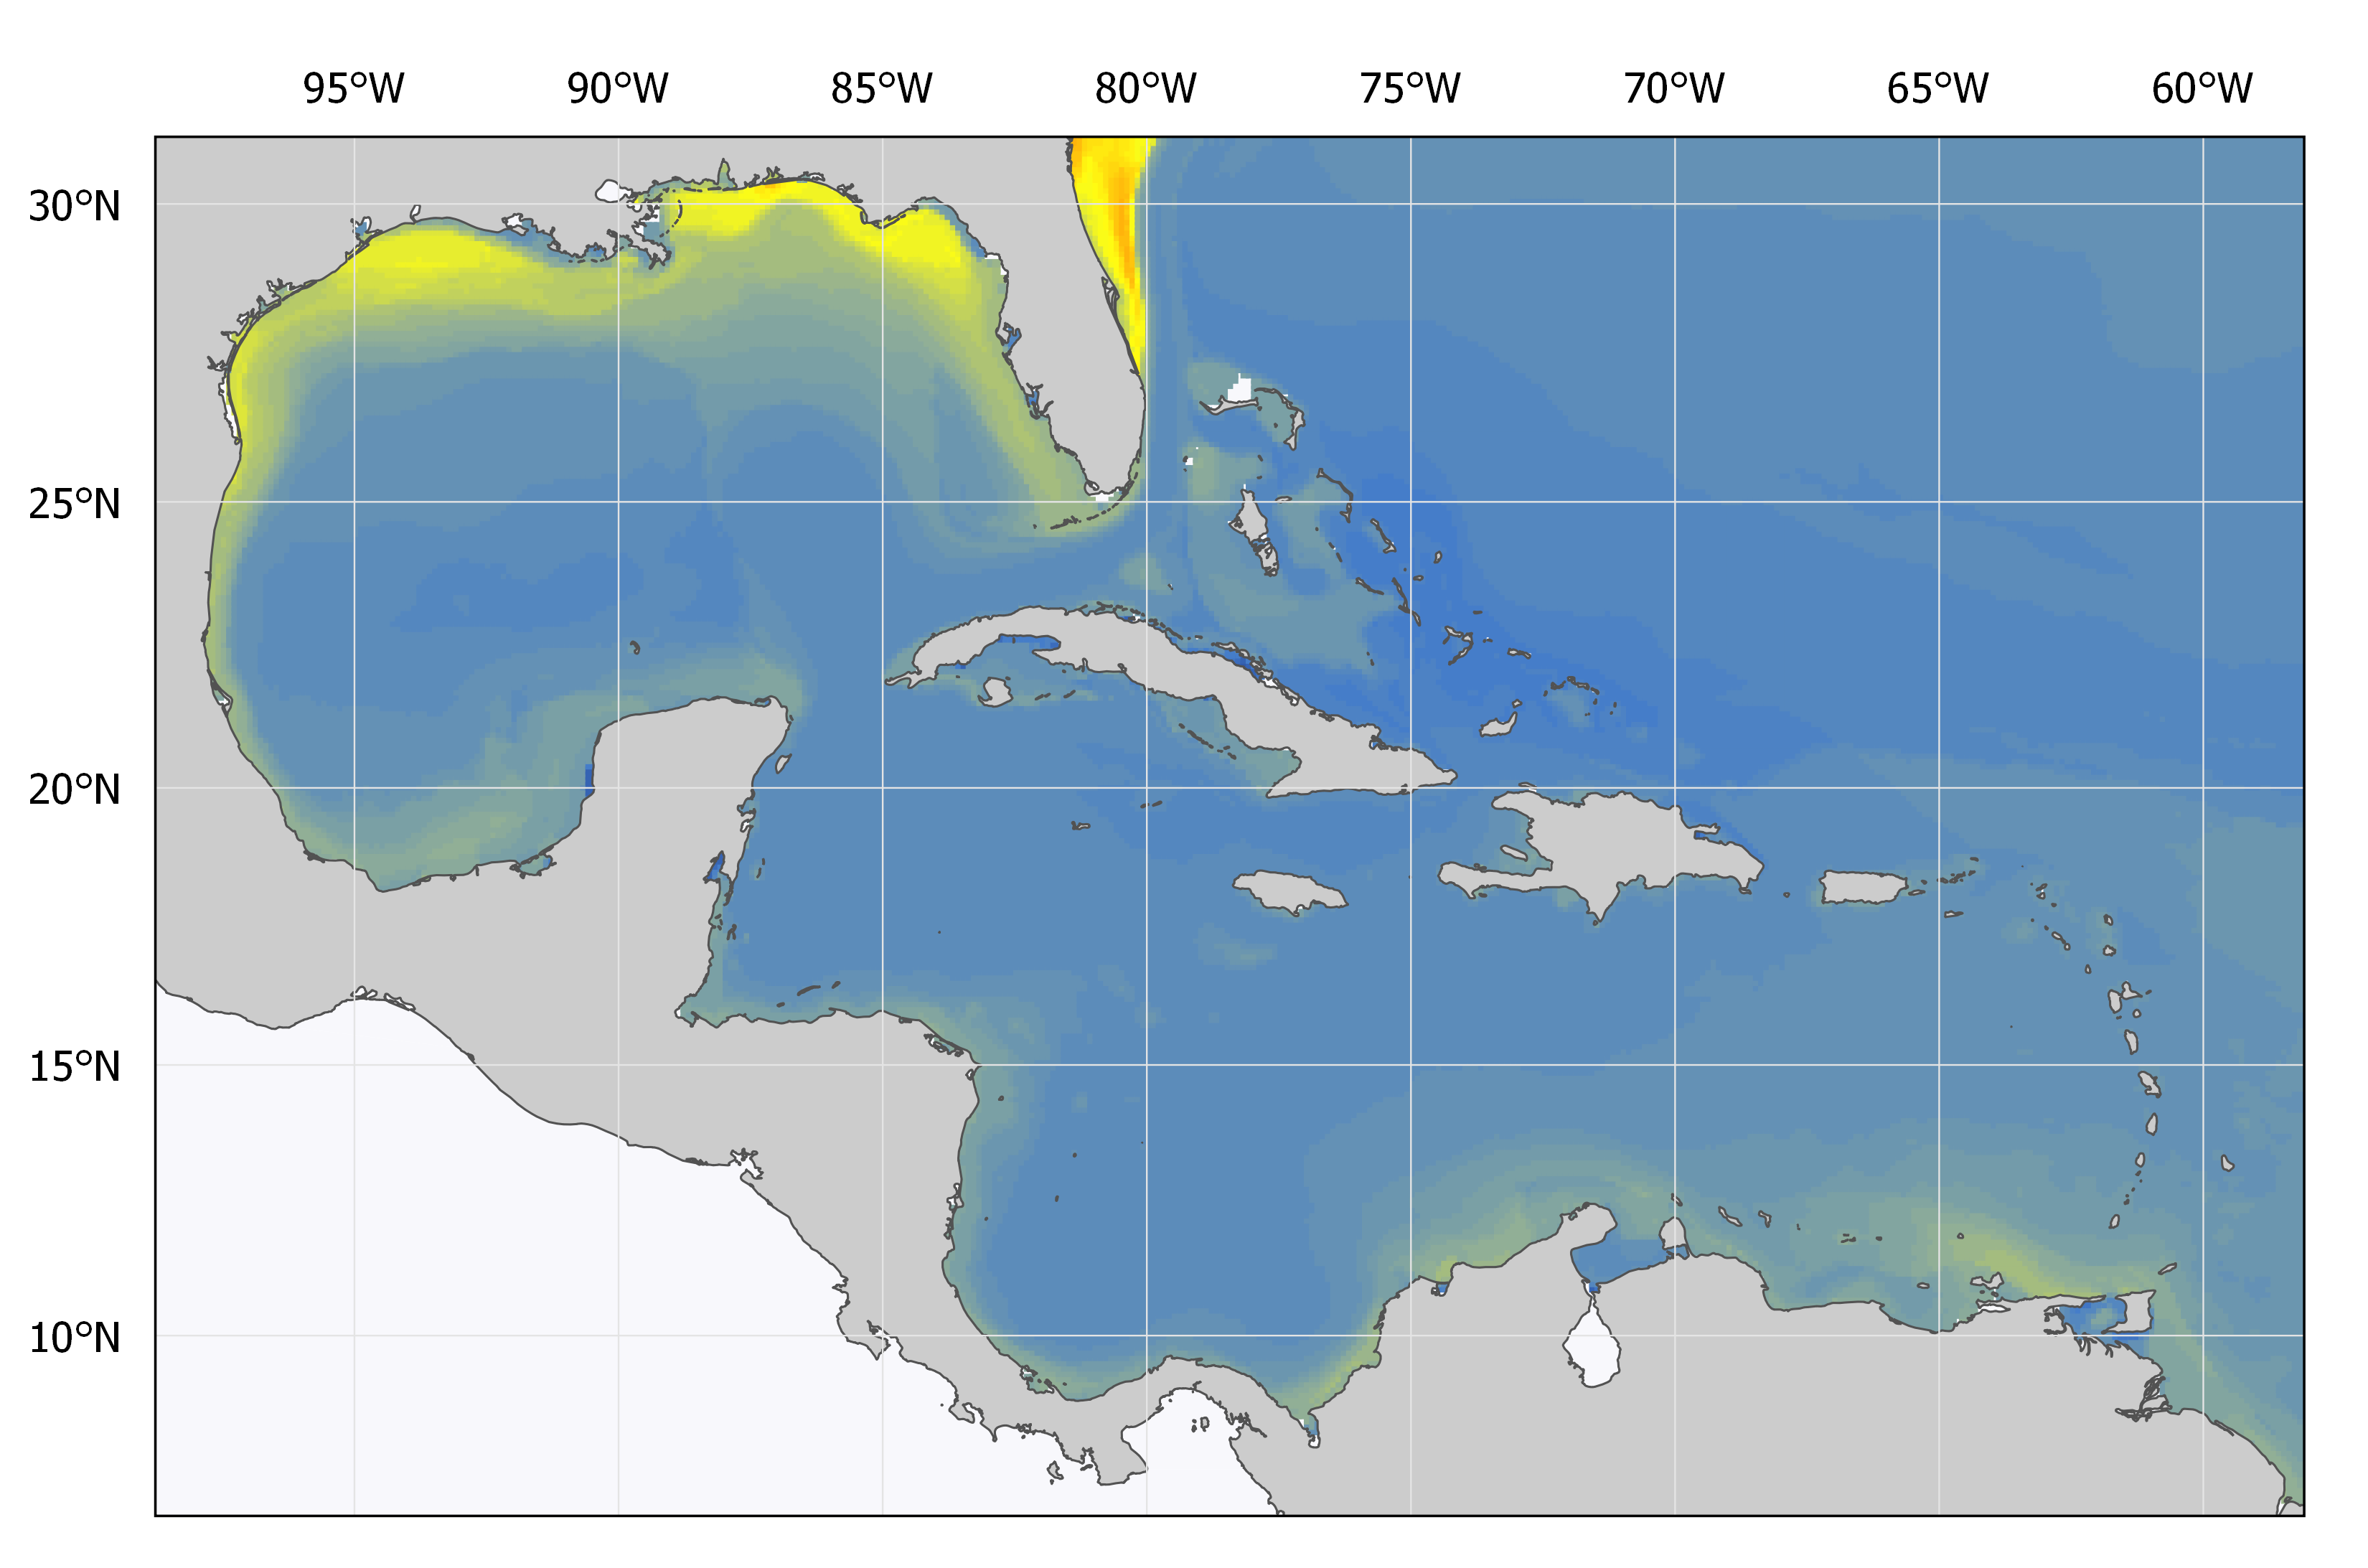
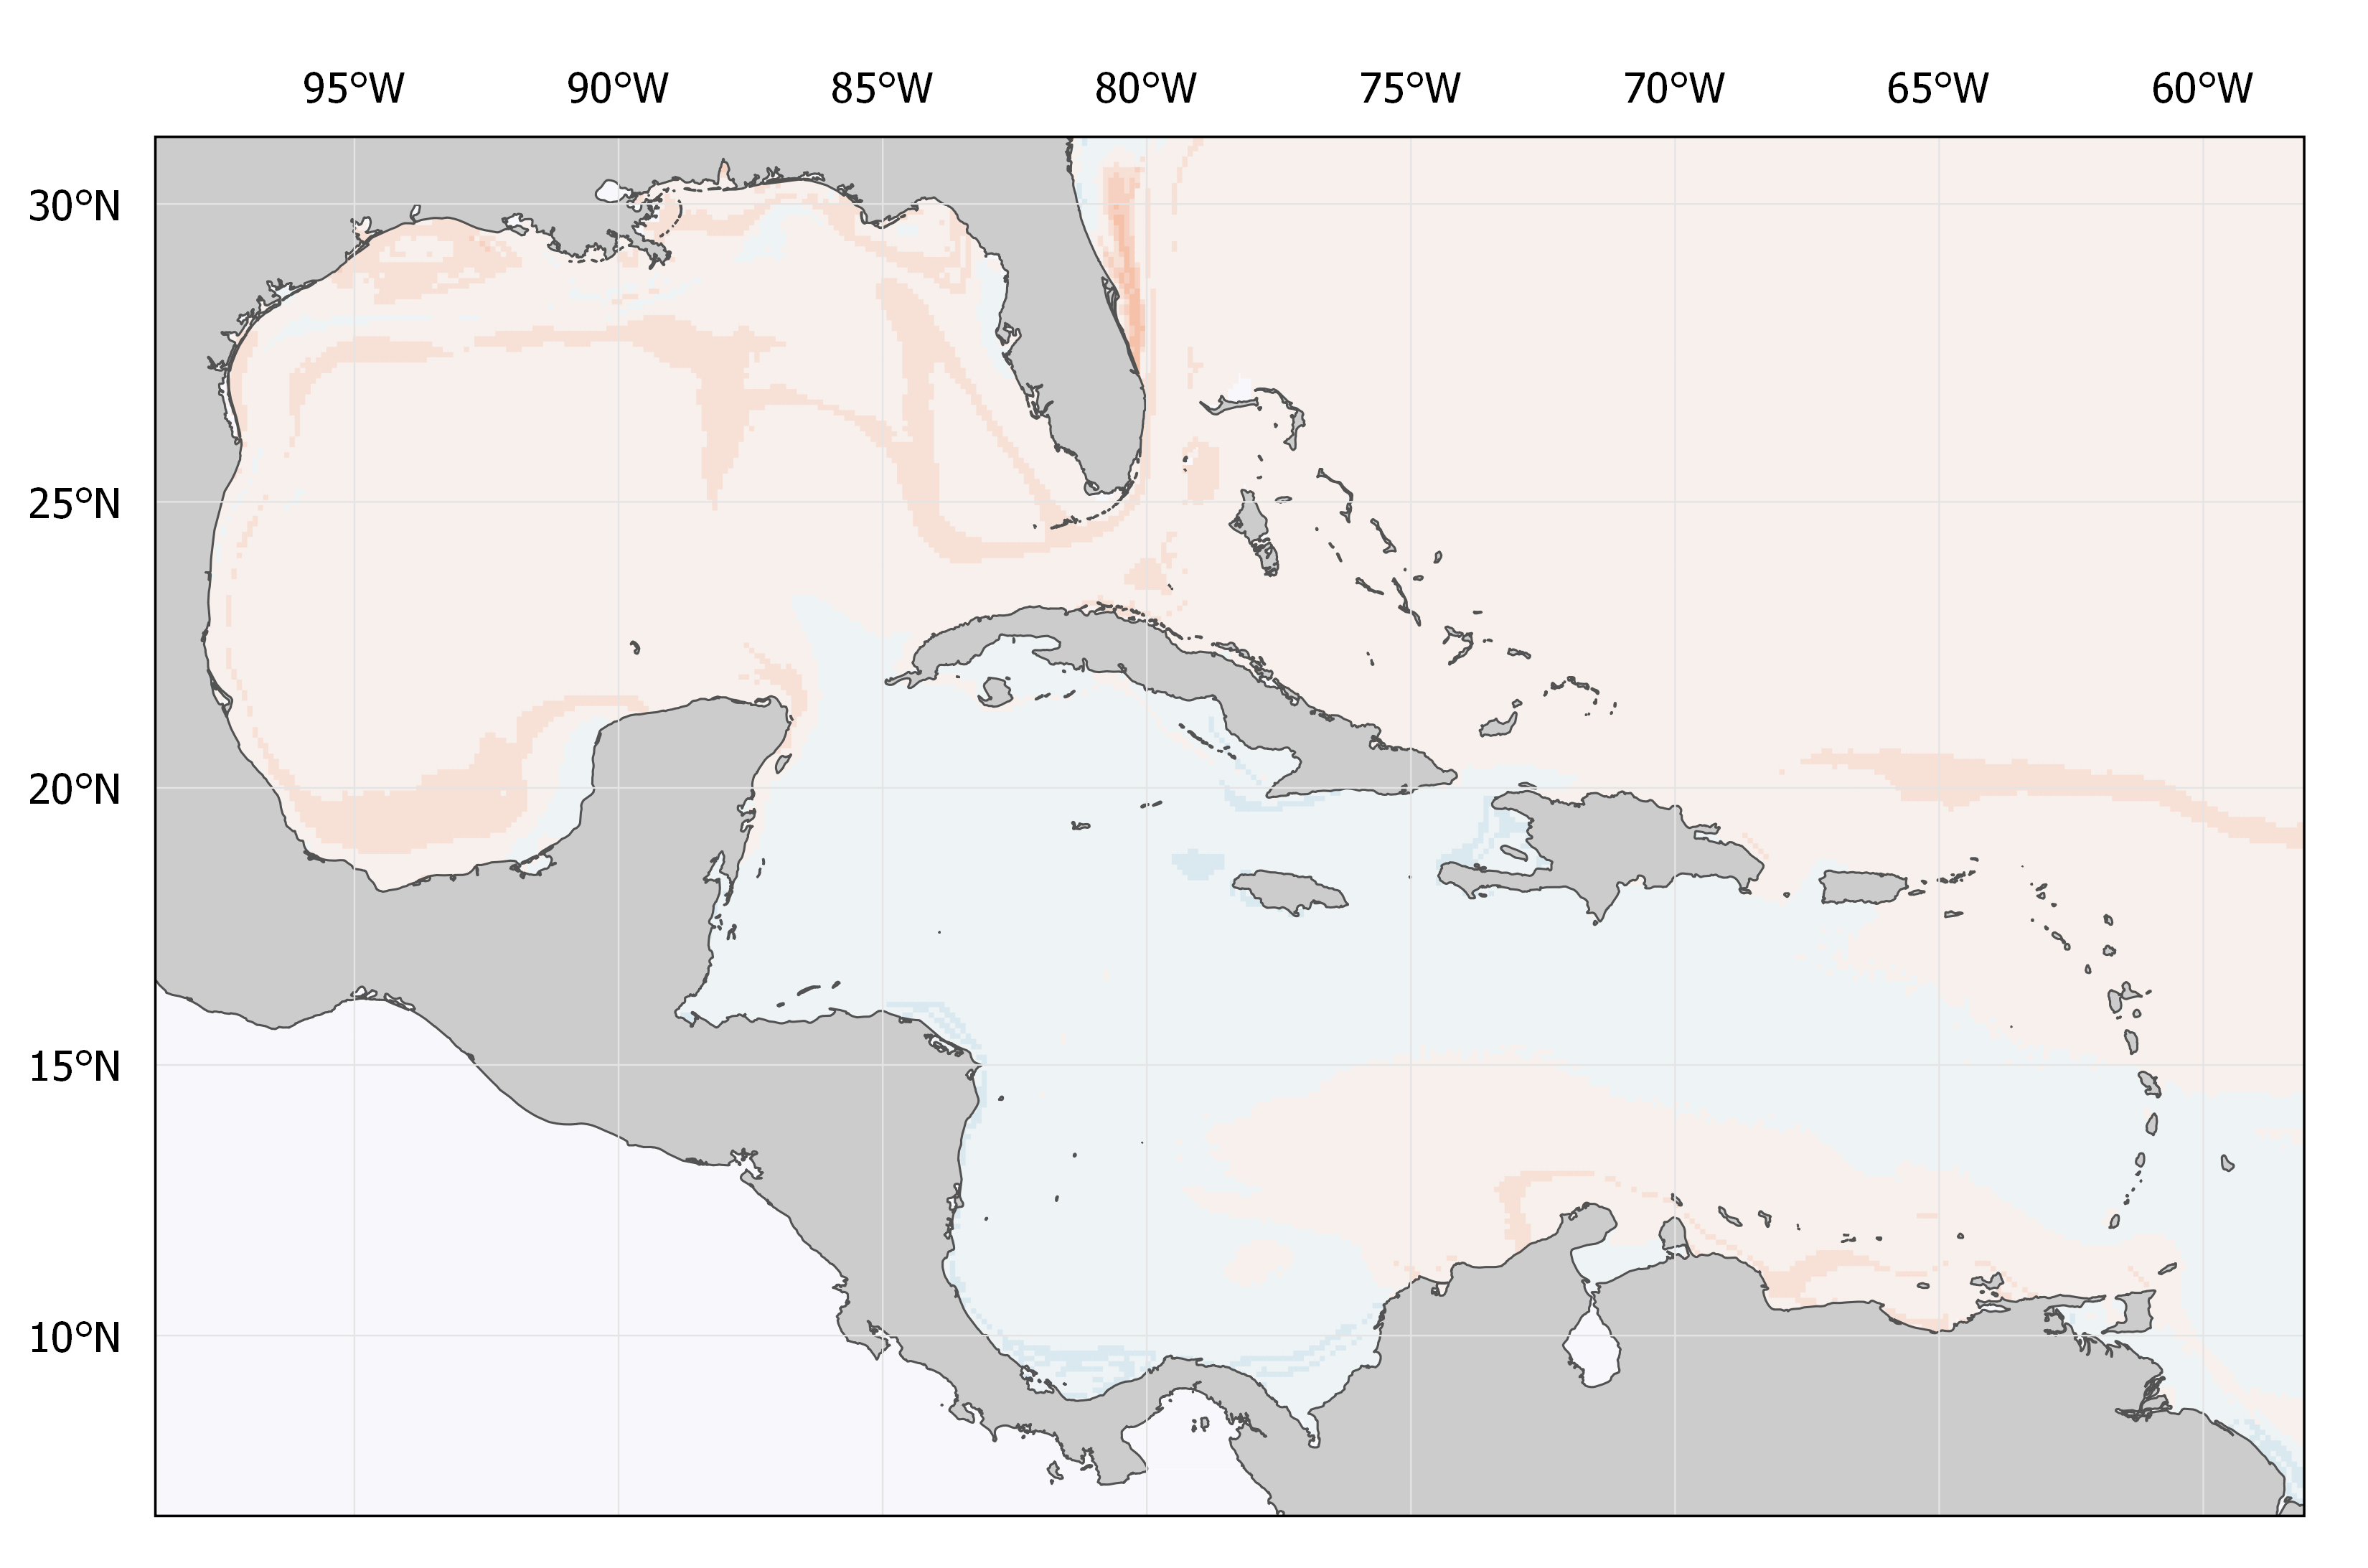
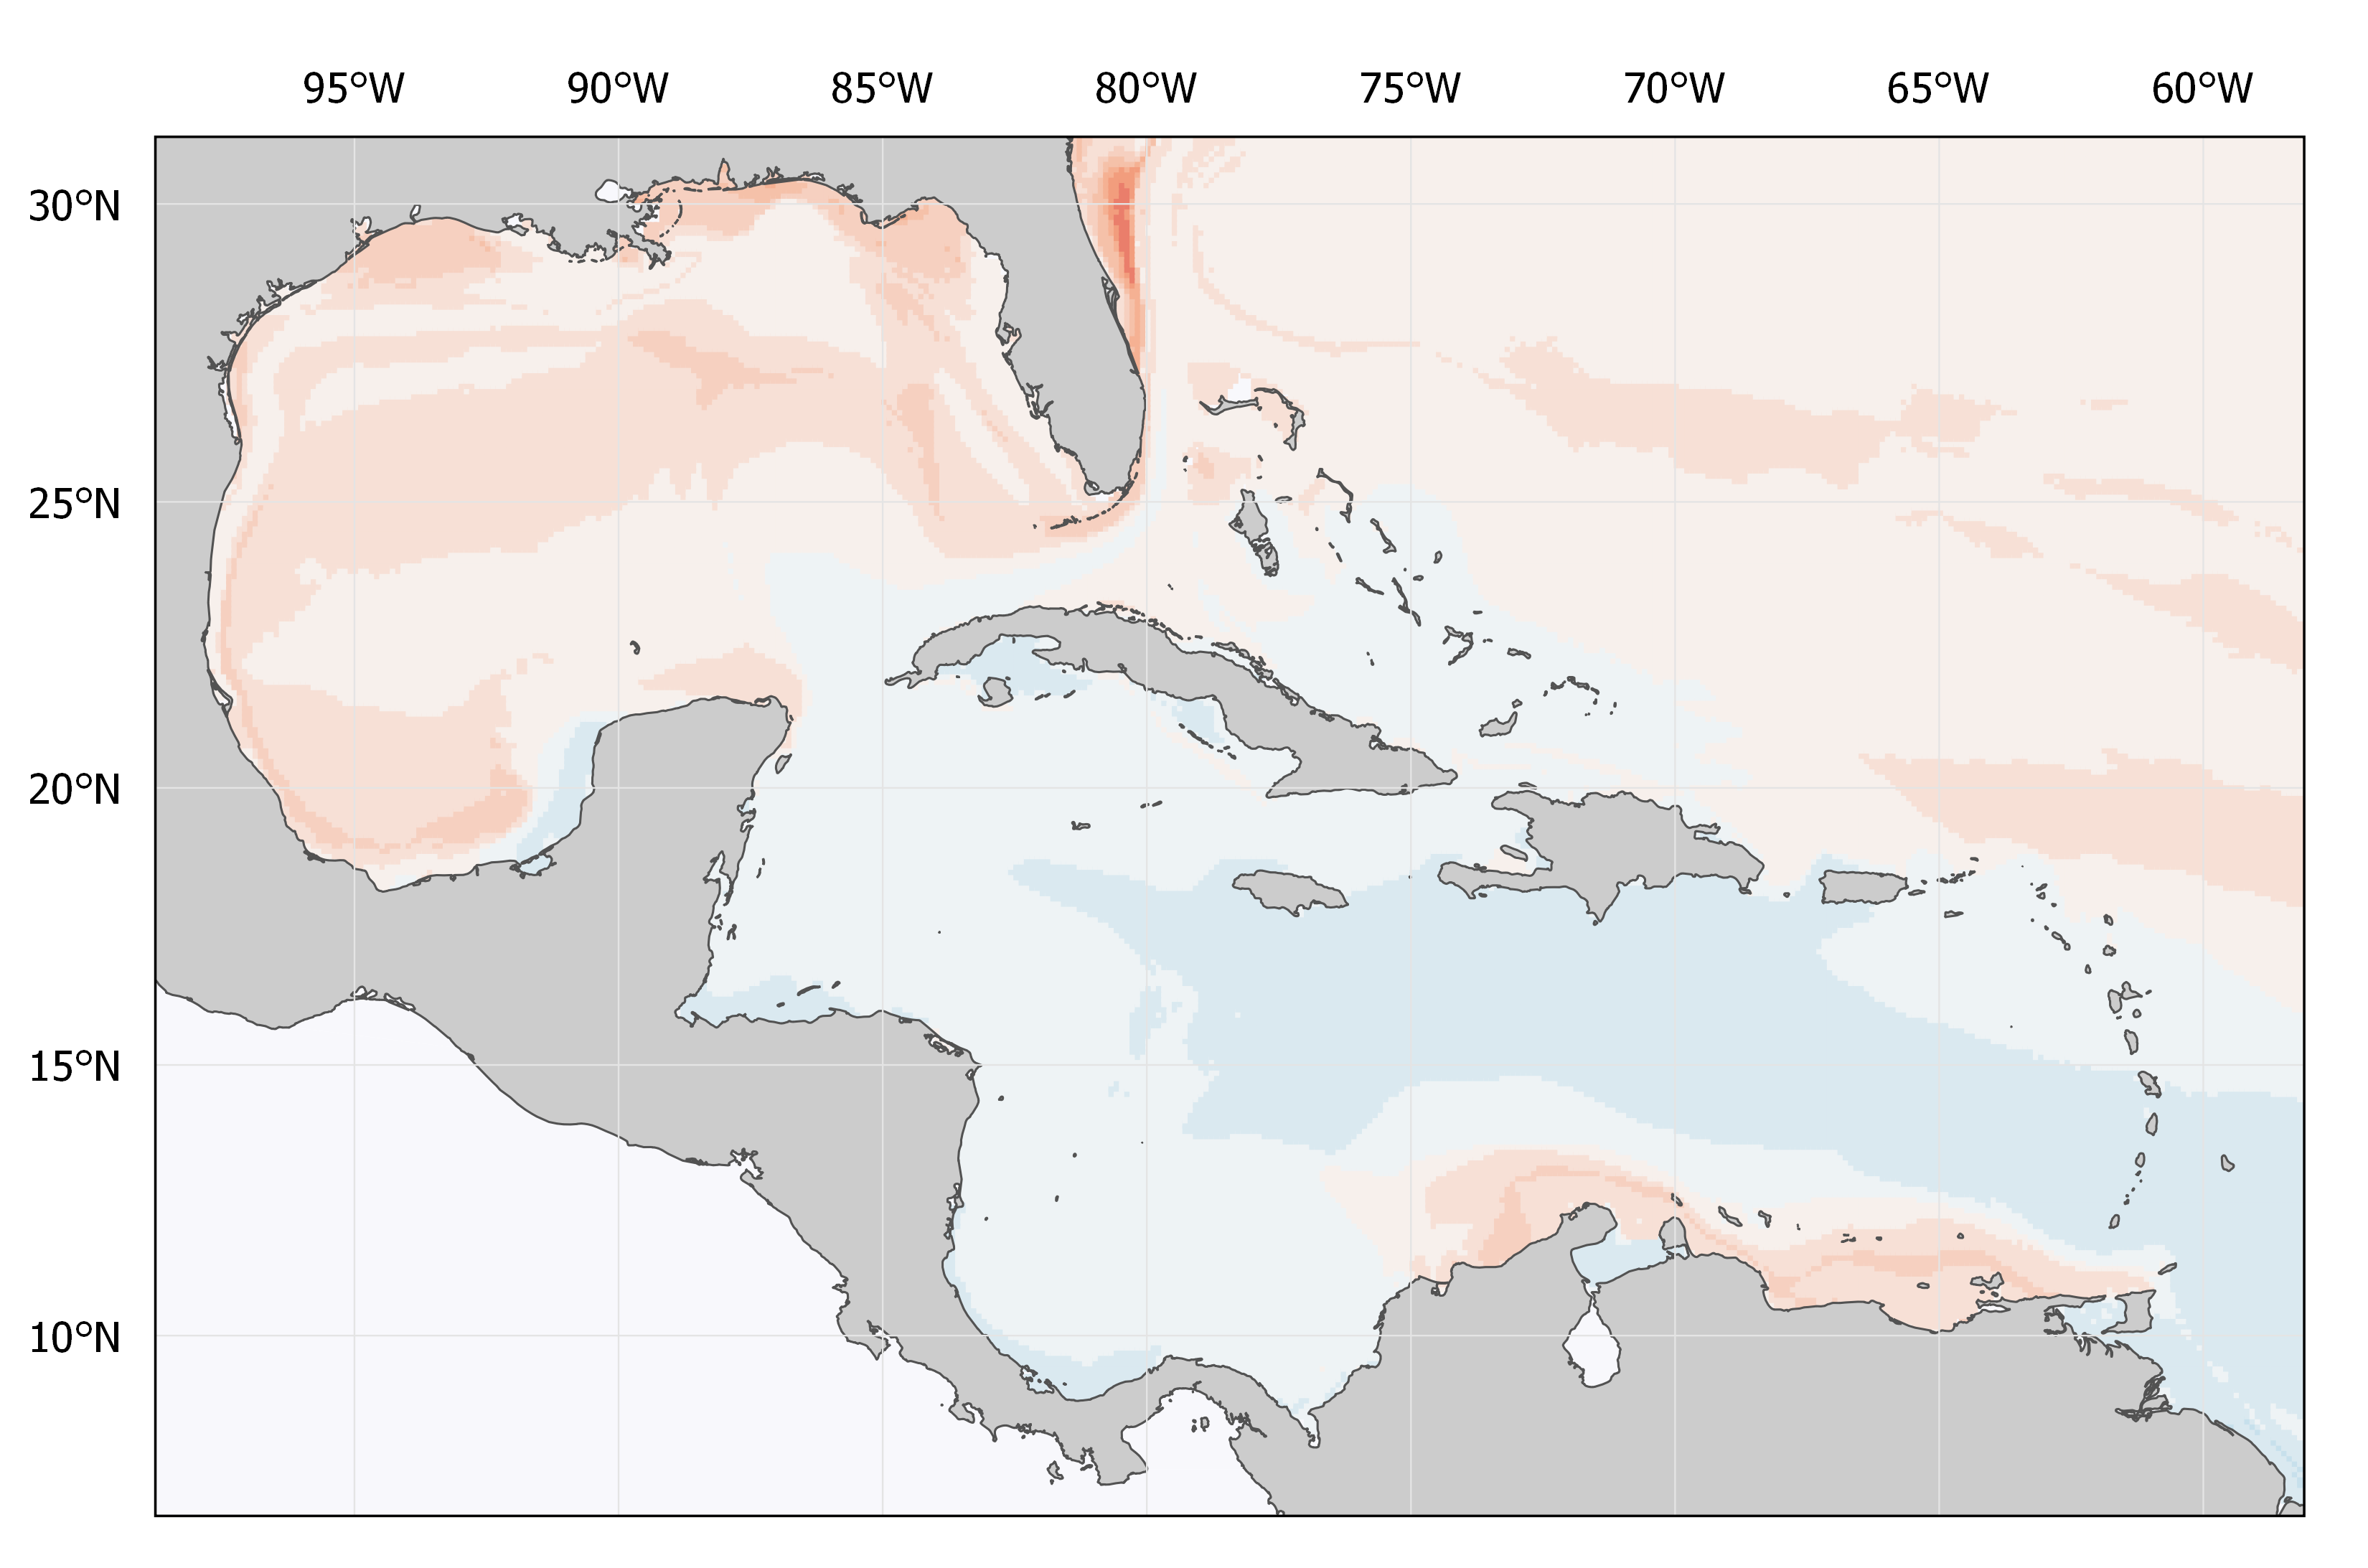
Common bottlenose dolphin (Tursiops truncatus) habitat suitability maps
Data and Resources
-
Distn Anomaly End Century (111) Common bottlenose dolphin (Tursiops truncatus).png
PNG
-
Distn Anomaly Mid Century (111) Common bottlenose dolphin (Tursiops truncatus).png
PNG
-
Distn End Century (111) Common bottlenose dolphin (Tursiops truncatus).png
PNG
-
Distn Mid Century (111) Common bottlenose dolphin (Tursiops truncatus).png
PNG
-
Distn Now (111) Common bottlenose dolphin (Tursiops truncatus).png
PNG
-
thumbnail.png
PNG
Source: Food and Agriculture Organization of the United Nations, Original...
Additional Info
| Field | Value |
|---|---|
| Source/Provider Institution | |
| Source URL | |
| Type | Map |
| Sector | Ecological |
| Category | Marine mammal |
| Habitat | Pelagic |
| Species group | Marine mammal |
| Economic group | Aquatic Mammals |
| Restrictions on use | |
| Publication/creation date | |
| Last update date | |
| Version | |
| Status | |
| Author | |
| Author Email | |
| Maintainer | |
| Maintainer Email | |
| Owner | CRFM |
| Owner email | secretariat@crfm.int |


